Views alone prove only that someone pressed play. They show that your thumbnail was intriguing or your ad targeting was broad, but they tell you virtually nothing about whether a prospect is closer to buying your software.
If you are a B2B SaaS marketing lead trying to justify video spend to your CEO or CFO, you cannot take view counts to an executive meeting. You have to connect your video directly to pipeline events, demo requests, free trial signups, booked calls, and accelerated deal velocity.
To measure video marketing ROI accurately, you need to tie video engagement directly to GA4 events, tag video interactions in your CRM, collect self-reported attribution at form submission, and run holdout tests.
This guide outlines a complete, step-by-step measurement framework for SaaS marketing teams. It separates what you can track with absolute precision from what you can only estimate, establishing a reliable, audit-proof model for proving that video actually drives revenue.
Turn your complex agent into a clear demo video now.
Explore how we visualize the invisible
What Does “Video Drives Pipeline” Actually Mean?
When marketers say a video drives pipeline, they mean the video actively influenced whether a qualified prospect entered a sales conversation or accelerated how fast they got there.
Pipeline represents the total monetary value of open, qualified sales opportunities. A video successfully drives pipeline only when those opportunities exist because of the video, or when deals close faster because the video answered critical evaluation questions early.
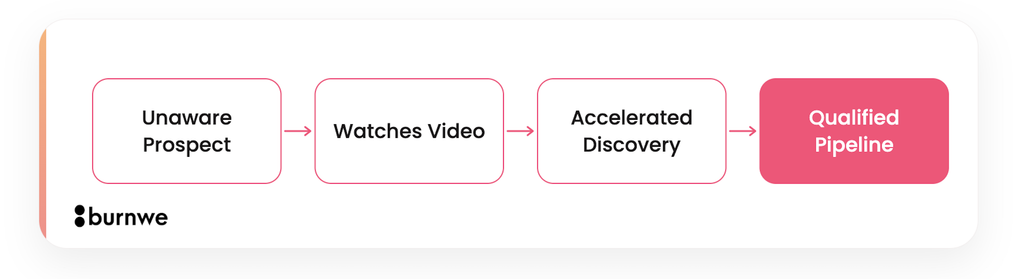
This is a causal statement and it is where most B2B reporting falls apart.
Standard analytics dashboards rarely track causation. Instead, they capture association: prospects who watched a video converted at a higher rate than those who did not.
However, association naturally overstates impact. A prospect who voluntarily watches a four-minute product walkthrough on your pricing page is already further along in their buying journey than a casual blog reader. They did not convert solely because of the video; they watched the video because they were already considering your solution.
Conflating correlation with causation leads to inflated internal metrics and unrealistic forecasts. To measure real impact, you must understand the three distinct tiers of data validation.
The 3 Levels of Proof in Video Analytics
Proving video marketing ROI requires moving up a ladder of statistical certainty. The higher you climb, the more defensible your numbers become.
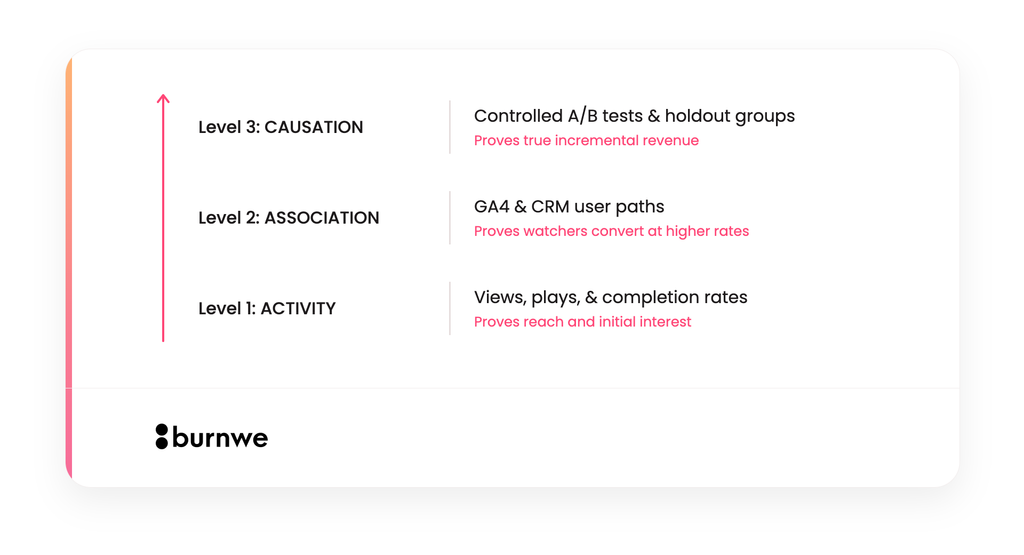
Level 1: Activity (Weakest)
This tier tracks superficial metrics: total views, impressions, page plays, and average watch time. You know that people interacted with the file, but you have zero visibility into whether it impacted their purchasing decision.
Level 2: Association (Moderate)
This tier links viewer behavior to conversion behavior using web analytics and CRM tracking. You can verify that prospects who watched at least 50% of your product demo converted at a 3.4x higher rate than non-viewers. Most high-performing B2B SaaS teams operate at this level for their day-to-day reporting.
Level 3: Causation (Strongest)
This tier uses controlled A/B split testing or regional holdout groups. By showing a video to Group A while withholding it from Group B, you isolate the video as the single variable driving incremental conversion lift.
Rule of Thumb: Aim for Level 2 tracking on every video asset you publish. Reserve Level 3 causation testing for high-budget assets, such as primary homepage explainers, paid acquisition videos, and core product landing page hero videos.
Why Industry Survey Numbers Demand Caution
When evaluating video marketing ROI, industry benchmarks should be treated as context rather than definitive proof.
Every year, broad industry surveys report glowing feedback about video performance. In an annual State of Video Marketing survey featuring 266 respondents, 82% of video marketers reported that video yields a positive ROI, down from 93% in the prior period. However, that same survey revealed that 17% of respondents do not track their video spend or returns at all.
These survey metrics highlight a critical industry reality: there is a wide gap between confidence and measurement.
A survey measures what marketers feel about their creative assets, not what their analytics setups actually prove. Relying on broad industry averages to justify your internal production budget is risky. Your software, deal size, sales cycle length, and distribution channels are unique, which is why building an internal measurement framework is essential.
Key Metrics Across the B2B SaaS Funnel
Tracking everything leads to tracking nothing. Different videos perform different jobs across the buyer’s journey, so you must select one primary metric and two supporting metrics for each stage before launching a video asset.
| Funnel Stage | Primary Video Objective | Primary Metric | Supporting Metrics | Tracking Location |
|---|---|---|---|---|
| Awareness | Reach target ICP accounts | Qualified Views (Target roles/accounts) | Watch time, social share rate | LinkedIn Campaign Manager, YouTube Analytics |
| Consideration | Explain value proposition clearly | Video Completion Rate (Product pages) | Pages per session post-view | GA4, Wistia / Vidyard Analytics |
| Evaluation | Prove capability & resolve technical doubts | Demo Requests from viewing sessions | Sales call mentions of video content | GA4 custom events, CRM activity log |
| Decision | Validate trust & remove buyer hesitation | Pipeline Value of viewing accounts | Stage-to-stage deal velocity acceleration | CRM (HubSpot/Salesforce) deal analytics |
| Retention | Accelerate onboarding & feature adoption | In-app Tutorial Completion Rate | Reduction in tier-1 support tickets | Product analytics (Mixpanel/Amplitude), HelpDesk |
Which Vanity Metrics Should You Drop?
Drop total view counts, raw impressions, and social media likes from your primary executive slide decks. They are easy to manipulate through broad ad targeting and offer minimal correlation with software revenue.
Keep raw view metrics internally as diagnostic indicators. For instance, if a video has a low play rate relative to page visits, your thumbnail or placement needs work. If watch time drops abruptly at second 5, your opening hook failed.
Your executive headline metric should always connect directly to a business outcome, such as: “Pipeline generated from web sessions that included a product video play.”
Setting Up Video Tracking in GA4: Step-by-Step
Google Analytics 4 includes built-in Enhanced Measurement for embedded YouTube videos, provided the JavaScript API is enabled on your player embed.
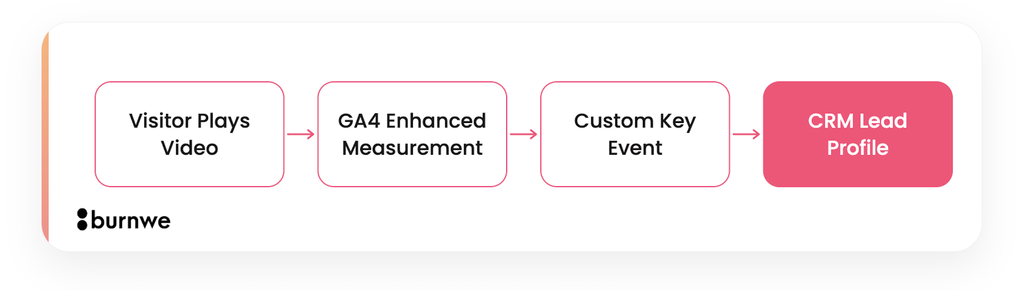
When activated, GA4 automatically listens for three standard event types:
- video_start: Triggered when the video begins playing.
- video_progress: Triggered as the viewer passes 10%, 25%, 50%, and 75% thresholds.
- video_complete: Triggered when the video reaches its end.
If you use custom HTML5 players or specialized video hosting platforms like Wistia or Vidyard, you must pass these exact event thresholds using Google Tag Manager (GTM)
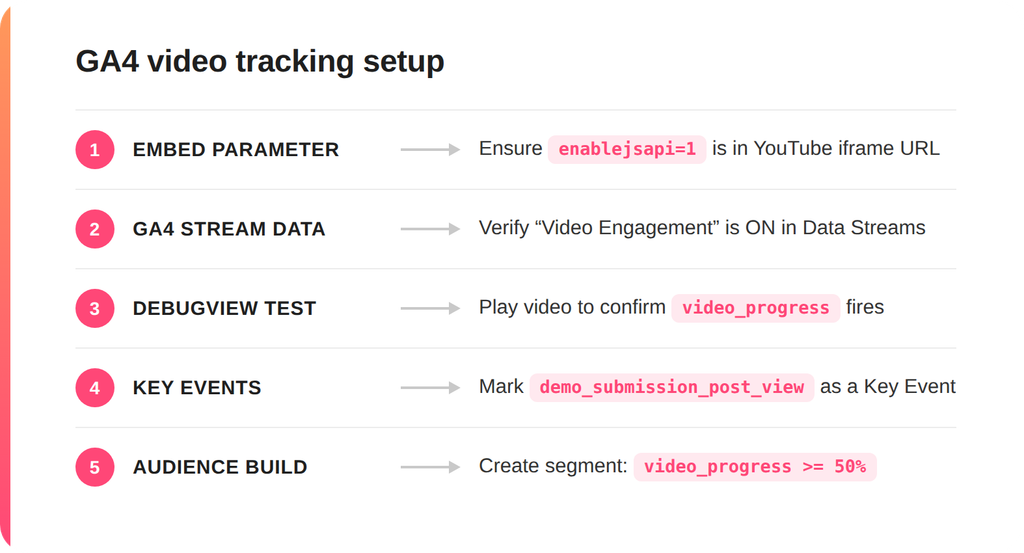
1. Configure the Embed Code
Ensure your YouTube iframe embed code explicitly enables the JavaScript API parameter:
<iframe src=”https://www.youtube.com/embed/uTbgFqFA9GU?enablejsapi=1″ width=”560″ height=”315″ frameborder=”0″ allowfullscreen></iframe>
2. Verify GA4 Enhanced Measurement
Navigate to GA4 > Admin > Data Streams > Web Stream, click the gear icon under Enhanced Measurement, and ensure Video Engagement is toggled ON.
3. Test Events in DebugView
Open your website in GA4 Preview mode via Google Tag Manager. Play the embedded video and inspect the DebugView column in GA4 to confirm that video_start and video_progress events fire reliably at each percentage milestone.
4. Create a High-Intent Audience
Build a dedicated custom audience segment in GA4 titled Engaged Video Viewers, defined as any user who triggers a video_progress event greater than or equal to 50%.
5. Mark Key Events
Mark your high-value conversion points (such as demo requests or trial starts following a video interaction) as Key Events inside GA4 to enable accurate conversion rate calculations.
Connecting Video Analytics to Your CRM
To prove that video impacts closed-won revenue, video interactions must be visible inside your CRM platform (such as HubSpot or Salesforce).
When a visitor fills out a contact form, their web session history, including watched videos, should attach directly to their contact record.
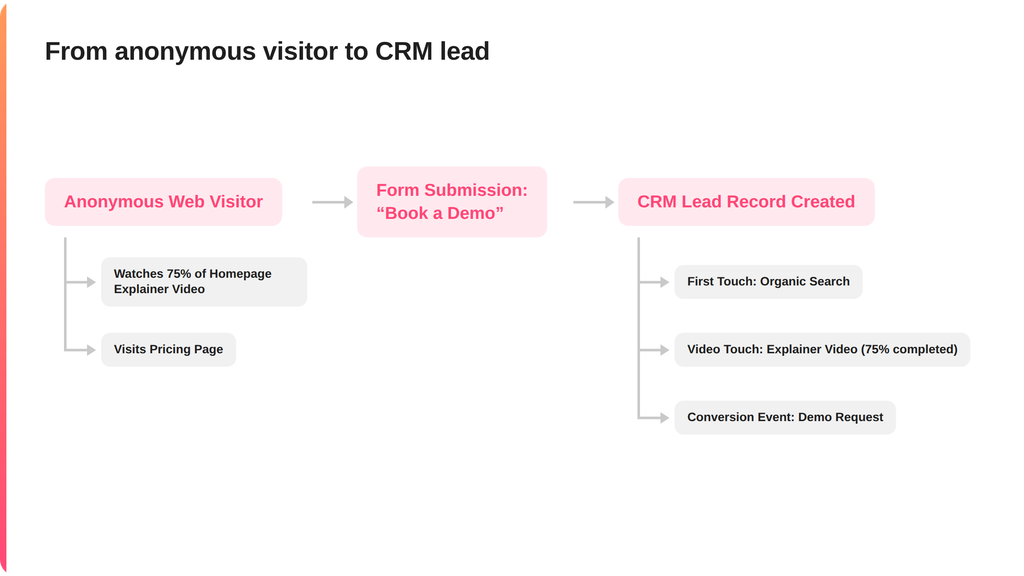
Most enterprise video hosts provide native integrations with HubSpot, Salesforce, and Marketo. These integrations pass custom timeline events directly into the lead record, enabling your sales team to review a prospect’s viewing history before an introductory call.
If an account executive sees that an inbound lead watched a full technical demo, they can skip basic product overviews and dive straight into implementation details, shortening the sales cycle.
For more on aligning video content with your broader distribution strategy, explore our guide on Video Marketing vs. Video Production for SaaS.
B2B SaaS Video Attribution Models
Because B2B sales cycles can span anywhere from 30 days to over nine months, relying on a single analytics attribution model will lead to blind spots. Modern B2B buyers conduct extensive research across untracked channels—watching embedded LinkedIn videos, consuming dark social recommendations, and sharing downloaded video files internally with buying committees.
Using a hybrid approach yields the most accurate picture of your video marketing ROI.
| Attribution Method | Core Function | Primary Strength | Known Weakness |
|---|---|---|---|
| Self-Reported Attribution | Asks buyers directly how they discovered your product via open text fields. | Captures dark social, offline mentions, and untracked social videos. | Subjective; relies on buyer memory. |
| Multi-Touch CRM Attribution | Assigns weighted credit to recorded digital touchpoints prior to deal creation. | Quantifies documented buyer interactions across the sales funnel. | Over-credits trackable clicks while ignoring untracked organic views. |
| GA4 Assisted Conversions | Evaluates pages featuring video that occurred along successful paths. | Simple to set up in standard analytics environments. | Measures presence rather than direct causation. |
| Branded Search Lift | Tracks spikes in branded search volume following major video releases. | Measures top-of-funnel brand awareness lift. | Cannot isolate video from simultaneous PR or campaign efforts. |
| Controlled Holdout Testing | Compares conversion rates between a group exposed to video vs. a control group. | Delivers clear statistical evidence of causation. | Requires high traffic volumes and strict testing discipline. |
Implementing Self-Reported Attribution
Self-reported attribution (SRA) is one of the most effective, low-cost additions to a B2B measurement stack.
Add an optional or required open-text form field to your primary demo request form:
“How did you first hear about us?”
Avoid drop-down menus. Drop-down lists force buyers into rigid choices (e.g., “Search Engine,” “Social Media”) that obscure nuance. Open-text fields allow buyers to respond naturally: “Saw your product breakdown video on LinkedIn,” or “Watched your YouTube integration guide.”
Review these inputs weekly and log them alongside your GA4 attribution metrics. If your software relies on founder-led content or creative video distribution, self-reported attribution frequently surface video touchpoints that standard web analytics miss entirely.
Designing a Controlled Video A/B Test
If you have sufficient site traffic, running a controlled A/B split test provides the strongest proof of video performance.
By isolating the video as the single variable on a high-intent page, you can calculate its exact conversion lift.
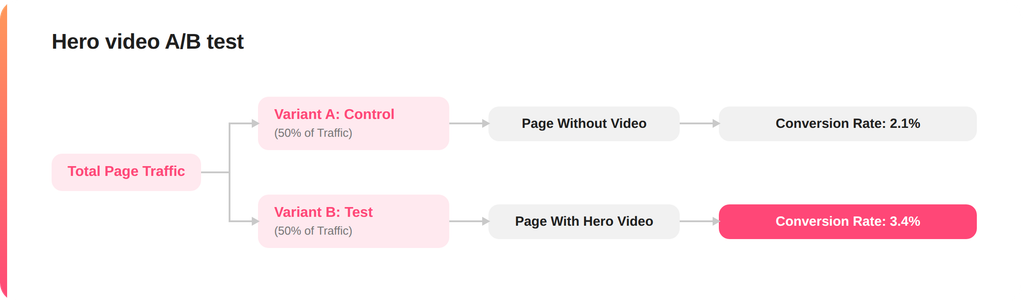
Standard Product Page Test Architecture
- Control Group (50% Traffic): Standard product page featuring static screenshots, body text, and a demo request form.
- Variant Group (50% Traffic): Identical page featuring an embedded hero product video placed prominently above the fold.
- Primary Goal: Percentage of total visitors who submit a demo request form.
- Secondary Goal: Sales-accepted opportunity rate from those conversions.
To run a reliable test, calculate your required sample size before starting. If your landing page receives 1,000 monthly visits with a baseline conversion rate of 2%, running a test for two weeks will not yield statistically significant data.
Use an standard statistical sample size calculator to determine how many total visitors and conversions are required to validate your results.
Staged Rollouts for Low-Traffic B2B Sites
If your product page traffic is too low for split testing, execute a Staged Regional Rollout or a Sequential Baseline Comparison instead.
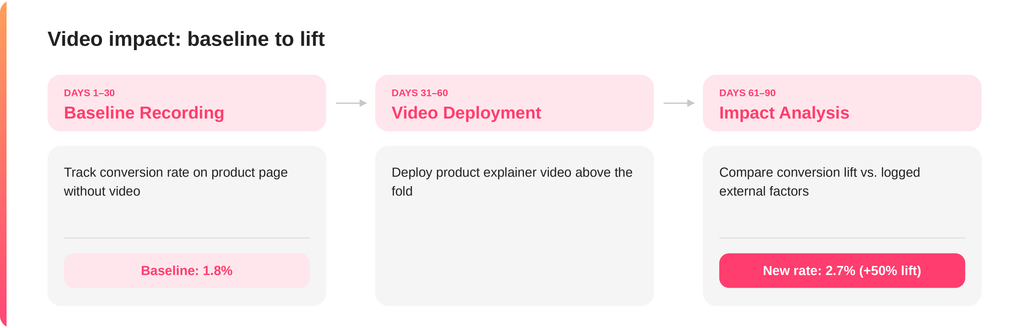
- Lock Your Baseline: Record performance data for 30 to 60 days before introducing the video. Document page views, form submissions, and sales opportunity conversion rates.
- Deploy the Asset: Embed your new product video above the fold on your target product page.
- Log External Factors: Maintain a shared marketing log documenting concurrent campaigns, PR releases, pricing changes, or ad spend shifts.
- Evaluate Performance: Compare post-launch conversion rates against your historical baseline. If conversion rates rise while external factors remain constant, you have a strong case for video-driven impact.
For examples of high-converting video formats, read our overview of the Best Video Marketing Examples.
Real-World Agency Insights: What Works in Practice
At Burnwe, having produced over 1,200+ videos for more than 450+ SaaS and tech companies worldwide, we consistently spot pattern trends in video performance tracking.
The clearest results come from videos designed around a single target action.
When a product video attempts to achieve multiple goals, such as inviting users to sign up for a newsletter, start a free trial, and request an enterprise demo, conversion clarity drops rapidly.
Explore an example of a video created by Burnwe for Peko.
When building high-converting B2B assets:
- Keep product explainers focused on a single key value proposition.
- Limit call-to-action choices at the end of the video to one clear step.
- Match the video’s depth to the buyer’s stage in the funnel.
Discover more AI Agent Demo Video Examples in our Portfolio.
Explore how we visualize the invisible
90-Day Video ROI Measurement Framework
Implementing a complete video measurement system takes planning, but it doesn’t require a large team. A team of one or two marketers can roll out this framework within 90 days.
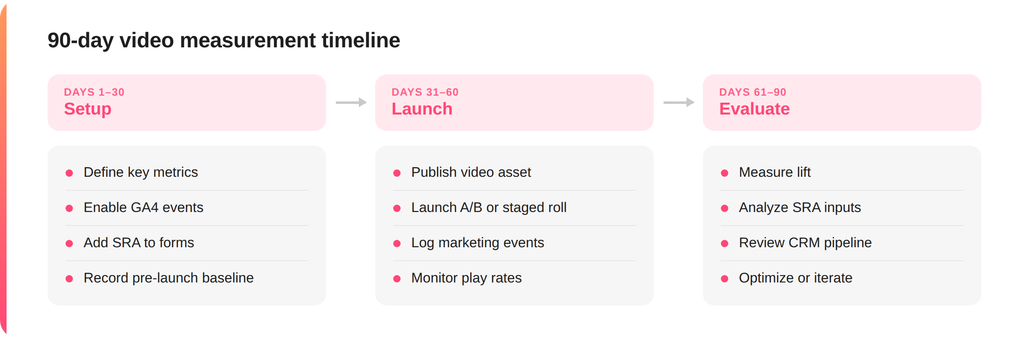
Days 1 to 30: System Setup & Baseline Calibration
- Define the primary business objective for your video asset (e.g., increase product page demo conversions).
- Enable GA4 video engagement tracking and test events in DebugView.
- Add an open-text “How did you hear about us?” field to your primary demo form.
- Record 30 days of baseline conversion data for the target URL.
Days 31 to 60: Controlled Launch & Monitoring
- Embed your high-converting product video above the fold on your target page.
- Initiate an A/B split test or a structured staged rollout.
- Maintain a central log of all external marketing activities to account for external variables.
- Track early diagnostic metrics, including play rates and 50% completion thresholds.
Days 61 to 90: Pipeline Analysis & Optimization
- Compare conversion performance against pre-launch baselines or control variants.
- Review self-reported attribution responses to spot untracked video views.
- Analyze CRM pipeline activity for leads who engaged with the video asset.
- Present findings to leadership using clear statistical boundaries, then optimize placement or messaging as needed.
Executive Reporting: How to Present Data to Leadership
When presenting video ROI results to executive leadership, keep your updates focused, transparent, and grounded in pipeline impact. Frame your findings around three clear data points:
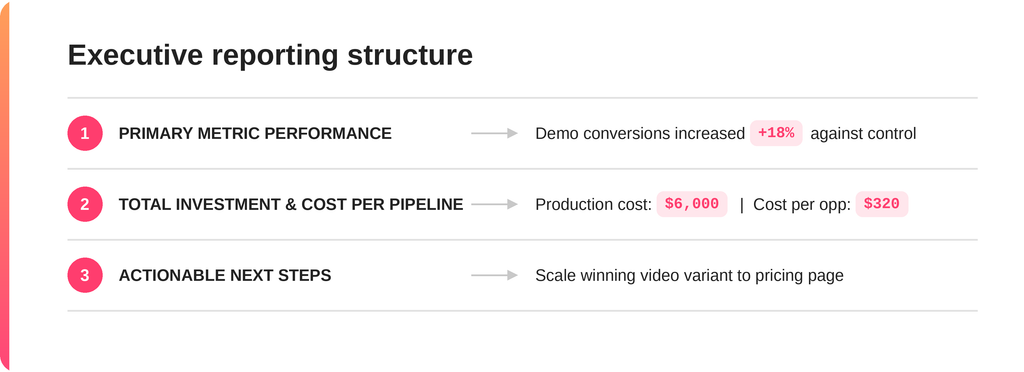
Avoid presenting unverified metrics or making overly broad claims.
Stating “Our product video generated $450k in new revenue” invites skepticism from finance teams. A more credible, audit-ready update sounds like:
“Over the past 60 days, visitors exposed to our new product explainer converted to demo requests at an 18% higher rate than the control group. Self-reported attribution confirmed 14 inbound accounts specifically credited the video asset.”
Red Flags in Agency ROI Claims
When evaluating external video production partners, scrutinize agencies that promise guaranteed financial returns or use vanity metrics as proof of success.
AGENCY RED FLAGS
- Guaranteed ROI multipliers (e.g., “10x ROI guaranteed”)
- Reporting total raw views as revenue proof
- Refusing to share underlying measurement methodologies
- Presenting isolated case study numbers without contextual details
REPUTABLE AGENCY PRACITCES
- Focusing on clear messaging and high production quality
- Aligning video structure with specific funnel goals
- Providing full sources and methodology for case studies
- Helping client teams set up accurate GA4 and CRM tracking
A reputable video partner will focus on factors within their direct control, such as value proposition clarity, hook retention, storytelling structure, and production quality, while collaborating with your marketing team to track performance inside your CRM and analytics stack.
For guidance on selecting agency partners, explore our analysis of the Best Video Marketing Agencies for Startups.
Troubleshooting Low-Performing Videos
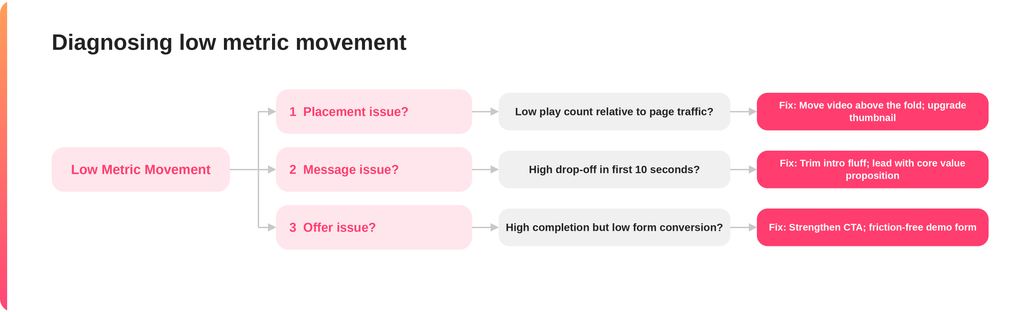
If a video fails to move your primary pipeline metric after a fair evaluation period, systematically diagnose the issue across three areas: placement, message, and offer.
1. Inspect Placement and Visibility
Check your play rate (Video Plays ÷ Page Views). If your play rate is under 10%, the video is likely hidden below the fold or using a non-engaging preview thumbnail. Move the player higher on the page and test thumbnail variations.
2. Evaluate Message and Retention
Inspect your GA4 completion rates. If viewers drop off within the first 10 seconds, the opening hook is too slow or overly generic. Lead with the core problem your software solves, avoiding long logo animations or extended introductions.
3. Refine the Offer and Call to Action
If viewers complete the video but fail to convert, your post-video offer lacks pull. Ensure the video ends with a single, clear, low-friction next step that directly matches the visitor’s stage in the buying process.
Want to partner with Burnwe for your neext video?
Explore how we visualize the invisible
FAQ’s
What is a good ROI for a B2B SaaS product video?
There is no single benchmark across the SaaS industry. ROI depends on your average deal size, landing page traffic, and sales cycle length. Compare the total cost of producing the video against the total value of qualified pipeline influenced, measured against a pre-launch baseline or control group.
How long should I wait before judging video performance?
Judge performance based on a target count of conversions rather than a fixed number of days. For enterprise B2B products with multi-month sales cycles, evaluate leading indicators (such as demo requests and trial starts) at 30 days, while evaluating lagging metrics (such as closed-won pipeline) at 90 to 180 days.
Can GA4 track video platforms other than YouTube?
Yes, but it requires custom setup. While GA4 tracks embedded YouTube players automatically via Enhanced Measurement, platforms like Wistia, Vidyard, or custom HTML5 players require event listeners configured inside Google Tag Manager to push video_start, video_progress, and video_complete events to GA4.
Is adding “How did you hear about us?” really worth it?
Yes. Self-reported attribution fields are easy to add and frequently catch untracked touch point, such as dark social shares, podcast mentions, and organic video views, that web analytics platforms miss.
Sources
- Annual State of Video Marketing Survey (2026) – Survey of 266 video marketing professionals regarding annual video budget tracking, confidence metrics, and reported ROI sentiment.
- Google Analytics 4 (GA4) Help Documentation – Enhanced Measurement Events & Video Engagement Tracking
- Wistia 2026 State of Video Report – B2B video engagement benchmarks, video completion rates, and viewer retention dynamics across SaaS product pages.
- Unbounce Landing Page Video Benchmark Study – Historical illustration of early landing-page A/B split testing comparing pages with and without video assets.
- Burnwe